import matplotlib.pyplot as plt
from IPython.core.display import HTML12wk-2: 클래스공부 3단계 – 문제연습
강의영상
youtube: https://youtube.com/playlist?list=PLQqh36zP38-zjmP7YXpRtdrKdWNOjo5_G
imports
클래스공부 3단계: 문제연습
암기사항
외우세요 (논리적으로 생각하지 말고)
#1 클래스의 선언: 클래스의 선언은 아래와 같이 하며 클래스의 이름은 대문자로 한다.
# 예시1: 좋은사례
class JungKKuckMa:
    pass
# 예시2: 나쁜사례 -- 클래스 이름은 대문자로 시작해야해
class jungkkuckma:
pass 딴지: 1. 사실 저거 말고도 선언하는 방법 있는데.. 2. 대문자가 아니어도 에러는 안나는데..
#2 클래스의 내용: 클래스의 내용은 메소드만을 정의하는데에만 사용한다.
# 예시1: 클래스의 내용을 메소드로만 작성한예시
class JungKKuckMa:
    def method1(self):
        blabla
    def method2(self):
        blabla
    def method3(self):
        blabla
    def method4(self):
        blabla
    def method5(self):
        blabla
# 예시2: 나쁜사례
class JungKKuckMa:
a=1
b=1 딴지: 꼭 메소드만 클래스의 내용으로 쓰라는 법은 없음
#3 메소드의 첫번째 입력은 항상 self 로 사용한다.
딴지: 이것도 꼭 그런건 아님
#4 __init__ 메소드는 “클래스 \(\to\) 인스턴스” 시점에 자동으로 실행되는 특수한 메소드이다.
문제풀이
각 예제의 조건에 맞는 클래스를 구현하라
- 예제1 – self는 항상 써야 해
아래의 조건에 맞는 클래스를 구현하라.
- 클래스에는 hello()라는 메소드가 정의되어 있으며, hello()의 기능은 “안녕하세요”를 출력하는 것이다.
(풀이)
class Klass:
    def hello(self):
        print("안녕하세요")
ins = Klass()ins.hello()안녕하세요- 예제2– __init__의 사용방법
아래의 조건에 맞는 클래스를 구현하라.
- “클래스 \(\to\) 인스턴스”의 과정에서 변수 a가 True 로 초기설정된다.
- 클래스에는 show()라는 메소드가 정의되어 있으며, show()의 기능은 a의 값을 print 하는 기능을 한다.
(풀이)
class Klass:
    def __init__(self):
        self.a = True
    def show(self):
        print(self.a)
ins = Klass()ins.show()True- 예제3– method의 정의 및 사용
아래의 조건에 맞는 클래스를 구현하라.
- “클래스 \(\to\) 인스턴스”의 과정에서 변수 a가 True 로 초기설정된다.
- 클래스에는 toggle() 이라는 메소드가 정의되어 있다. 이 기능은 변수 a의 값이 True 이면 False 로, False 이면 True 로 바꾸는 역할을 한다.
- 클래스에는 show()라는 메소드가 정의되어 있다. 이 기능은 a의 값을 print 하는 기능을 한다.
(풀이)
class Klass:
    def __init__(self):
        self.a = True
    def toggle(self):
        self.a = not self.a
    def show(self):
        print(self.a)
ins = Klass()ins.aTrueins.toggle()ins.show()Falseins.toggle()
ins.toggle()
ins.show()Falseins.toggle()
ins.toggle()
ins.toggle()
ins.show()True- 예제4 – method의 정의 및 사용
아래의 조건에 맞는 클래스를 구현하라.
- “클래스 \(\to\) 인스턴스”의 과정에서 변수 a가 0으로 초기설정된다.
- 클래스에는 up()라는 메소드가 정의되어 있다. up()의 기능은 a의 값을 1증가시키는 기능을 한다.
- 클래스에는 show()라는 메소드가 정의되어 있다. show()의 기능은 a의 값을 print 하는 가능을 한다.
(풀이)
class Klass:
    def __init__(self):
        self.a = 0
    def up(self):
        self.a = self.a + 1
    def show(self):
        print(self.a)
ins = Klass() ins.show()0ins.up()
ins.up()
ins.show()2- 예제5 – 외부입력을 사용하는 __init__
아래의 조건에 맞는 클래스를 구현하라.
- “클래스 \(\to\) 인스턴스”의 과정에서 변수 a의 값이 사용자가 입력한 값으로 초기설정된다.
- 클래스에는 show()라는 메소드가 정의되어 있다. show()의 기능은 a의 값을 print 하는 가능을 한다.
(풀이)
class Klass:
    def __init__(self,value):
        self.a = value
    def show(self):
        print(self.a)
ins = Klass(397)ins.show()397- 예제6 – 외부입력을 사용하는 method
아래의 조건에 맞는 클래스를 구현하라.
- “클래스 \(\to\) 인스턴스”의 과정에서 변수 a가 0으로 초기설정된다.
- 클래스에는 up()라는 메소드가 정의되어 있다. up()의 기능은 a의 값을 1증가시키는 기능을 한다.
- 클래스에는 jump()라는 메소드가 정의되어 있다. jump()는 jump_size 를 입력으로 받으며 a의 값을 jump_size 만큼 증가시키는 기능을 한다.
- 클래스에는 show()라는 메소드가 정의되어 있다. show()의 기능은 a의 값을 print 하는 기능을 한다.
(풀이)
class Klass:
    def __init__(self):
        self.a = 0
    def up(self):
        self.a = self.a + 1
    def jump(self,jump_size):
        self.a = self.a + jump_size
    def show(self):
        print('a={}'.format(self.a))
ins = Klass()ins.show()a=0ins.up()
ins.show()a=1ins.up()
ins.jump(100)
ins.show()a=102- 예제7 – 메소드에서 메소드 사용하기
아래의 조건에 맞는 클래스를 구현하라.
- “클래스 \(\to\) 인스턴스”의 과정에서 변수 a가 0으로 초기설정된다.
- 클래스에는 up()라는 메소드가 정의되어 있다. up()의 기능은 a의 값을 1증가시키는 기능을 한다.
- 클래스에는 jump()라는 메소드가 정의되어 있다. jump()는 jump_size 를 입력으로 받으며 a의 값을 jump_size 만큼 증가시키는 기능을 한다.
- 클래스에는 reset()이라는 메소드가 정의되어 있다. reset()는 a의 값을 0으로 초기화하는 역할을 한다.
- 클래스에는 show()라는 메소드가 정의되어 있다. show()의 기능은 a의 값을 print 하는 기능을 한다.
class Klass:
    def __init__(self):
        self.a = 0
    def up(self):
        self.a = self.a + 1
    def jump(self,jump_size):
        self.a = self.a + jump_size
    def show(self):
        print('a={}'.format(self.a))
    def reset(self):
        self.__init__()
ins = Klass()ins.show()a=0ins.up()
ins.jump(3)
ins.up()
ins.up()
ins.jump(5)ins.show()a=11ins.reset()
ins.show()a=0- 예제8: – 이미지출력
아래의 코드를 관찰
url = 'https://github.com/guebin/PP2023/blob/main/posts/03_Class/burgerking.png?raw=true'
html_str = '<img src={url} width="600">'.format(url=url)
display(HTML(html_str))
아래의 조건에 맞는 클래스를 구현하라.
- “클래스 \(\to\) 인스턴스”의 과정에서 변수 url이 위에서 제시된 값으로 초기화된다.
- 클래스에는 show()라는 함수가 있어서 url에 해당하는 이미지를 출력해주는 기능을 가진다.
(풀이)
class Klass:
    def __init__(self):
        self.url = 'https://github.com/guebin/PP2023/blob/main/posts/03_Class/burgerking.png?raw=true'
    def show(self):
        html_str = '<img src={url} width="600">'.format(url=self.url)
        display(HTML(html_str))
ins = Klass()ins.show()
- 예제9– 이미지 출력 + 횟수 기록
- “클래스 \(\to\) 인스턴스”의 과정에서 변수 url이 위에서 제시된 값으로 초기화된다.
- 클래스에는 show()라는 함수가 있어서 (1) url에 해당하는 이미지를 출력하고 (2) “당신은 이 그림을 \(n\)번 보았습니다” 를 출력하는 기능을 한다. 여기에서 \(n\)은 그림을 본 횟수
class Klass:
    def __init__(self):
        self.n = 0
        self.url = 'https://github.com/guebin/PP2023/blob/main/posts/03_Class/burgerking.png?raw=true'
    def show(self):
        self.n = self.n + 1
        html_str = '<img src={url} width="600">'.format(url=self.url)
        display(HTML(html_str))
        print("당신은 이 그림을 {}번 보았습니다.".format(self.n))
ins = Klass()ins.show()
당신은 이 그림을 1번 보았습니다.- 예제10 – 여러 인스턴스 동시관리
예제9에서 만든 클래스를 이용하여 아래의 url에 해당하는 이미지를 출력하라.
- https://github.com/guebin/PP2023/blob/main/posts/03_Class/JungGGuckMa.jpg?raw=true
.show()를 이용해 두 이미지를 번갈아 가며 관찰하고 횟수가 올바르게 카운트되는지 확인하라.
ins1 = Klass()
ins2 = Klass()
ins2.url = 'https://github.com/guebin/PP2023/blob/main/posts/03_Class/JungGGuckMa.jpg?raw=true'ins1.show()
당신은 이 그림을 1번 보았습니다.ins2.show()
당신은 이 그림을 1번 보았습니다.ins2.show()
당신은 이 그림을 3번 보았습니다.ins1.show()
당신은 이 그림을 2번 보았습니다.숙제
import numpy as np
import matplotlib.pyplot as plt
import yfinance as yf1. Stock 이라는 이름의 클래스를 만들고 아래의 기능을 넣어라.
(1) crawling 메소드: crawling 메소드는 start_date, end_date, code 를 입력으로 받는 함수이며, code 에 대응하는 주식의 주가를 크롤링하는 기능을 가진다. 크롤링된 주식의 가격은 numpy array 형태로 저장되어 있다.
hint: 아래의 코드를 관찰
start_date = "2023-01-01"
end_date = "2023-05-02"
code = "005930.KS"
y = yf.download(code, start=start_date, end=end_date)['Adj Close'].to_numpy()
[*********************100%***********************] 1 of 1 completed(2) smoothing 메소드: smoothing는 크롤링된 주가 \({\boldsymbol y}=(y_1,\dots,y_n)\)를 아래의 수식을 통하여 \(n\)회 변환하는 기능을 한다.
- \(\tilde{y}_1= \frac{1}{4}(3y_1 + y_2)\)
- \(\tilde{y}_i= \frac{1}{4}(y_{i-1}+2y_i+y_{i+1})\), for \(i=2,3,\dots,n-1\)
- \(\tilde{y}_n= \frac{1}{4}(y_{n-1}+3y_{n})\)
따라서 smoothing 메소드는 횟수 \(n\)을 입력으로 받으며 만약에 스무딩횟수 \(n=50\) 라면 위의 변환을 50번 수행한다는 의미이다.
hint: 아래의 코드는 스무딩횟수가 50일 경우 계산결과를 나타낸다.
T = len(y)
M = (np.eye(T) + np.array([abs(i-j)<2 for i in range(T) for j in range(T)]).reshape(T,T))/4
M[0,0] = 3/4; M[-1,-1]= 3/4
np.linalg.matrix_power(M,50)@y
array([57829.5198335 , 57913.45130858, 58074.98767179, 58302.49883106,
58580.85980052, 58893.6342362 , 59225.15916278, 59562.11733312,
59894.34552673, 60214.84152593, 60519.13801971, 60804.35235309,
61068.26212859, 61308.69372022, 61523.36985828, 61710.19151418,
61867.78289263, 61996.05025836, 62096.51500847, 62172.26857912,
62227.52668205, 62266.88741201, 62294.48217892, 62313.22926322,
62324.3595587 , 62327.30400351, 62319.94157793, 62299.13135202,
62261.40667203, 62203.6964973 , 62123.95164058, 62021.58264813,
61897.65327525, 61754.8142197 , 61597.00327565, 61428.97717458,
61255.77153928, 61082.20095767, 60912.50404337, 60750.20562209,
60598.21432284, 60459.11116399, 60335.53051955, 60230.505942 ,
60147.65985811, 60091.15743789, 60065.40911365, 60074.57426582,
60121.97095198, 60209.5197855 , 60337.34065497, 60503.58512128,
60704.53726274, 60934.96461047, 61188.6585627 , 61459.07535255,
61739.97532625, 62025.95922279, 62312.81470816, 62597.61454921,
62878.54876233, 63154.52323711, 63424.60866005, 63687.46393417,
63940.87457 , 64181.52954181, 64405.10955815, 64606.6863928 ,
64781.35656111, 64924.97537827, 65034.83581495, 65110.15528052,
65152.28414726, 65164.61511766, 65152.2332612 , 65121.38844629,
65078.88899085, 65031.50938302, 64985.48231823, 64946.11407554,
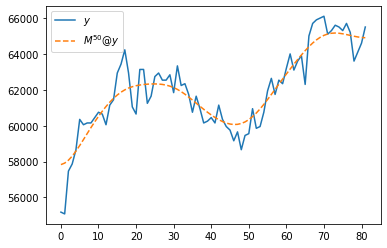
64917.53018147, 64902.53224792])(3) plot 메소드: plot 메소드는 크롤링된 주가와 스무딩결과를 plot 하는 역할을 한다.
hint: 아래의 코드를 관찰
plt.plot(y,label=r'$y$')
plt.plot(np.linalg.matrix_power(M,50)@y,'--',label=r'$M^{50}@y$')
plt.legend()
<matplotlib.legend.Legend at 0x7f37b524f8e0>
(풀이)
class Stock:
    def __init__(self):
        self.y = None
        self.sy = None
    def crawling(self,code,start_date,end_date):
        self.y = yf.download(code, start=start_date, end=end_date)['Adj Close'].to_numpy()
    def smoothing(self,n):
        T = len(self.y)
        self.n = n
        M = (np.eye(T) + np.array([abs(i-j)<2 for i in range(T) for j in range(T)]).reshape(T,T))/4
        M[0,0] = 3/4; M[-1,-1]= 3/4
        self.sy = np.linalg.matrix_power(M,50)@self.y
    def plot(self):
        plt.plot(self.y,label=r'$y$')
        plt.plot(self.sy,'--',label=r'$M^{}@y$'.format(self.n))
plt.legend() 2. 1에서 만든 Stock 클래스에서 kakao 인스턴스를 생성하라. 생성된 kakao 인스턴스에서 crawling 메소드를 이용하여 아래의 조건에 맞는 주식을 긁어오라.
- code: ‘035720.KS’ (카카오)
- start_date = “2023-01-01”
- end_date = “2023-05-26”
이후 .smoothing 메소드를 이용하여 \(n=50\)회 스무딩하고 .plot 메소드를 이용하여 결과를 시각화하라.
(사용예시)
kakao = Stock()kakao.crawling(code='035720.KS',start_date='2023-01-01',end_date='2023-05-26')[*********************100%***********************] 1 of 1 completedkakao.smoothing(50)kakao.plot()
(풀이) 사용예시가 곧 풀이임
3. LinearRegression 이라는 이름의 클래스를 만들고 아래의 기능을 넣어라.
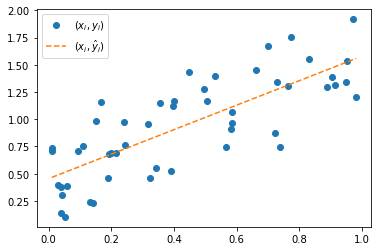
(1) “클래스 \(\to\) 인스턴스” 인 시점에 길이가 \(n\)인 numpy array \({\bf x}=(x_1,\dots,x_n)\), \({\bf y}=(y_1,\dots,y_n)\)을 입력으로 받아 내부에 저장한다.
(2) fit 메소드: fit은 내부에 저장된 \({\bf x}\), \({\bf y}\)를 이용하여 \(\hat{\bf y}=(\hat{y}_1,\dots,\hat{y}_n)\)을 계산하는 역할을 한다. 계산은 아래의 수식을 이용한다.
\[\hat{\bf y}= {\bf X}({\bf X}^T {\bf X})^{-1}{\bf X}^T {\bf y}, \quad {\bf X}=\begin{bmatrix} 1 & x_1 \\ 1 & x_2 \\ \dots \\ 1 & x_n \end{bmatrix}\]
hint 아래의 코드를 관찰하라.
x =  np.array([0.00983, 0.01098, 0.02951, 0.0384 , 0.03973, 0.04178, 0.0533 ,
               0.058  , 0.09454, 0.1103 , 0.1328 , 0.1412 , 0.1497 , 0.1664 ,
               0.1906 , 0.1923 , 0.198  , 0.2141 , 0.2393 , 0.2433 , 0.3157 ,
               0.3228 , 0.3418 , 0.3552 , 0.3918 , 0.3962 , 0.4    , 0.4482 ,
               0.496  , 0.507  , 0.53   , 0.5654 , 0.582  , 0.5854 , 0.5854 ,
               0.6606 , 0.7007 , 0.723  , 0.7305 , 0.7383 , 0.7656 , 0.7725 ,
               0.831  , 0.8896 , 0.9053 , 0.914  , 0.949  , 0.952  , 0.9727 ,
               0.982  ])
y =  np.array([0.7381, 0.7043, 0.3937, 0.1365, 0.3784, 0.3028, 0.1037, 0.3846,
               0.706 , 0.7572, 0.2421, 0.232 , 0.9855, 1.162 , 0.4653, 0.6791,
               0.6905, 0.6865, 0.9757, 0.7665, 0.9522, 0.4641, 0.5498, 1.1509,
               0.5288, 1.1195, 1.1659, 1.4341, 1.2779, 1.1648, 1.4002, 0.7472,
               0.9142, 0.9658, 1.0707, 1.4501, 1.6758, 0.8778, 1.3384, 0.7476,
               1.3086, 1.7537, 1.5559, 1.2928, 1.3832, 1.3115, 1.3382, 1.536 ,
               1.9177, 1.2069])
n = len(x)
X = np.stack([np.ones(n),x],axis=1)
yhat = X@np.linalg.inv(X.T@X)@X.T@y (3) plot 메소드:c
hint 아래의 코드를 관찰하라.
plt.plot(x,y,'o',label=r'$(x_i,y_i)$')
plt.plot(x,yhat,'--',label=r'$(x_i,\hat{y}_i)$')
plt.legend()
<matplotlib.legend.Legend at 0x7f37ac1a8f10>
(풀이)
class LinearRegression:
    def __init__(self,x,y):
        self.x = x
        self.y = y
    def fit(self):
        n = len(self.x)
        self.X = np.stack([np.ones(n),self.x],axis=1)
        self.yhat = self.X@np.linalg.inv(self.X.T@self.X)@self.X.T@self.y
    def plot(self):
        plt.plot(self.x,self.y,'o',label=r'$(x_i,y_i)$')
        plt.plot(self.x,self.yhat,'--',label=r'$(x_i,\hat{y}_i)$')
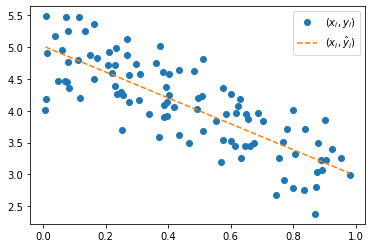
plt.legend()4. LinearRegression 을 이용하여 아래의 자료에 대한 분석을 진행하라. 즉 .fit() 을 이용하여 \(\hat{y}_i\) 를 계산하고 .plot()을 이용하여 결과를 시각화하라.
x = np.array(
    [0.007, 0.008, 0.008, 0.011, 0.037, 0.047, 0.059, 0.07 , 0.072,
     0.075, 0.078, 0.08 , 0.082, 0.11 , 0.114, 0.117, 0.133, 0.15 ,
     0.161, 0.163, 0.172, 0.208, 0.209, 0.221, 0.229, 0.231, 0.234,
     0.235, 0.249, 0.251, 0.256, 0.269, 0.269, 0.273, 0.275, 0.298,
     0.305, 0.309, 0.34 , 0.362, 0.371, 0.374, 0.382, 0.387, 0.388,
     0.394, 0.395, 0.397, 0.401, 0.404, 0.419, 0.433, 0.436, 0.466,
     0.481, 0.492, 0.495, 0.508, 0.511, 0.512, 0.554, 0.57 , 0.574,
     0.575, 0.584, 0.6  , 0.601, 0.615, 0.618, 0.623, 0.629, 0.633,
     0.646, 0.65 , 0.654, 0.662, 0.673, 0.686, 0.702, 0.744, 0.754,
     0.766, 0.772, 0.781, 0.798, 0.8  , 0.807, 0.836, 0.837, 0.871,
     0.873, 0.877, 0.879, 0.889, 0.891, 0.902, 0.904, 0.923, 0.952,
     0.981]
)
y = np.array(
[4.004, 4.189, 5.483, 4.902, 5.174, 4.468, 4.95 , 4.463, 5.476,
4.446, 4.764, 5.244, 4.357, 4.796, 5.464, 4.196, 5.244, 4.868,
5.358, 4.493, 4.831, 4.716, 4.929, 4.588, 4.718, 4.389, 4.985,
4.266, 4.291, 3.697, 4.248, 4.88 , 5.126, 4.563, 4.131, 4.728,
4.168, 4.584, 3.953, 4.747, 3.592, 5.023, 4.601, 3.904, 4.092,
4.37 , 3.922, 4.145, 4.576, 4.25 , 4.051, 3.616, 4.634, 3.496,
4.631, 4.025, 4.197, 4.226, 4.808, 3.676, 3.834, 3.197, 4.36 ,
3.547, 3.956, 3.522, 4.26 , 3.443, 3.97 , 4.068, 4.186, 3.262,
3.452, 3.946, 3.875, 3.444, 3.501, 3.959, 3.843, 2.679, 3.266,
3.506, 2.916, 3.714, 4.007, 2.795, 3.329, 2.756, 3.72 , 2.381,
2.798, 3.035, 3.492, 3.22 , 3.073, 3.85 , 3.233, 3.396, 3.264,
2.986]
) (풀이)
linreg = LinearRegression(x,y)
linreg.fit()
linreg.plot()