import numpy as np
import matplotlib.pyplot as plt
import sklearn.tree
#---#
import warnings
warnings.filterwarnings('ignore')11wk-42: Weighted_Data / 의사결정나무 weights
1. 강의영상
2. Imports
3. weights
# 예제1 – 아래의 예제를 생각하자.
X = np.array([1,2,3,4,5,6,7]).reshape(-1,1)
y = np.array([10,11,12,20,21,22,23])plt.plot(X,y,'o')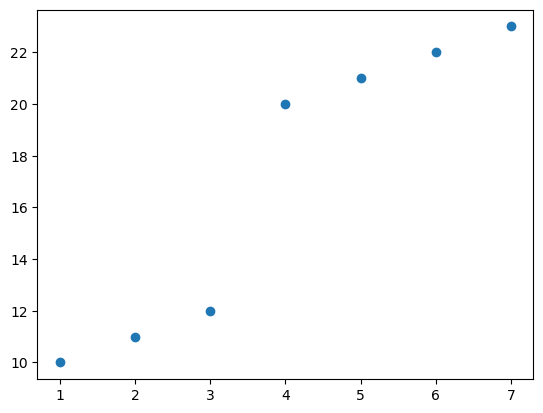
- 어디에서 분기점을 나누는게 좋을까? 당연히 3.5 정도..
predictr = sklearn.tree.DecisionTreeRegressor(max_depth=1)
predictr.fit(X,y)
sklearn.tree.plot_tree(predictr);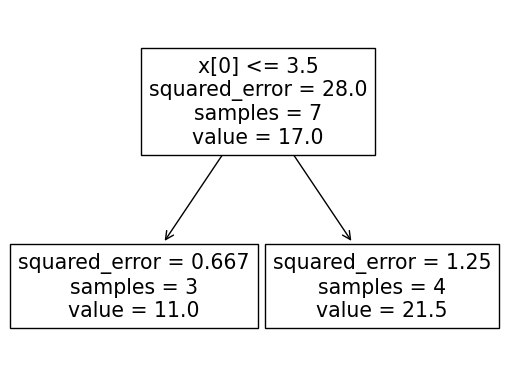
#
# 예제2 – 아래의 예제를 생각하자.
X = np.array([1]*5000+[2]*5000+[3,4,5,6,7]).reshape(-1,1)
y = np.array([10]*5000+[11]*5000+[12,20,21,22,23])plt.plot(X,y,'o',alpha=0.1)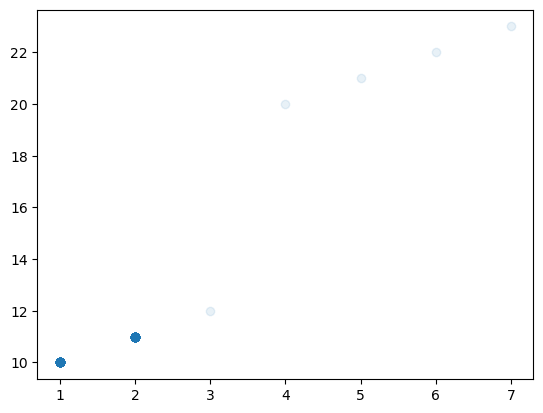
- 분기점은 어디에 나누는게 좋을까? 이 경우는 1.5근처에서 나누는게 합리적으로 보임
predictr = sklearn.tree.DecisionTreeRegressor(max_depth=1)predictr.fit(X,y)DecisionTreeRegressor(max_depth=1)In a Jupyter environment, please rerun this cell to show the HTML representation or trust the notebook.
On GitHub, the HTML representation is unable to render, please try loading this page with nbviewer.org.
DecisionTreeRegressor(max_depth=1)
sklearn.tree.plot_tree(
    predictr
)
[Text(0.5, 0.75, 'x[0] <= 1.5\nsquared_error = 0.299\nsamples = 10005\nvalue = 10.505'),
Text(0.25, 0.25, 'squared_error = 0.0\nsamples = 5000\nvalue = 10.0'),
Text(0.75, 0.25, 'squared_error = 0.089\nsamples = 5005\nvalue = 11.009')]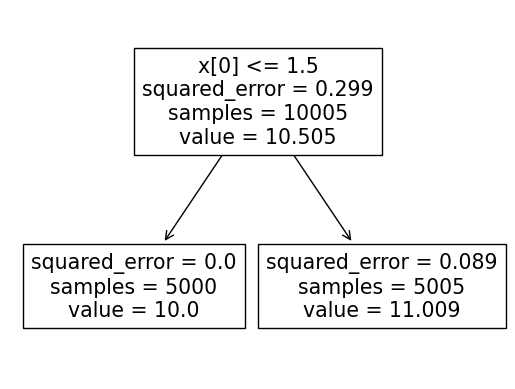
#
# 예제3 – 다시 아래의 예제를 생각하자.
X = np.array([1,2,3,4,5,6,7]).reshape(-1,1)
y = np.array([10,11,12,20,21,22,23])plt.plot(X,y,'o')
plt.plot(X[:2],y[:2],'o')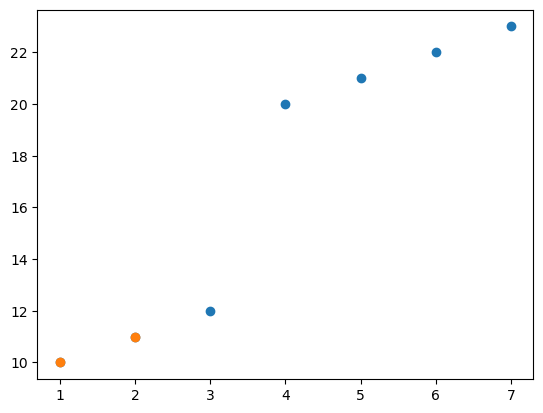
- 주황색점들을 잘 맞추는 것이 파란색점들을 잘 맞추는 것보다 5000배정도 중요하다고 상상하자.
predictr = sklearn.tree.DecisionTreeRegressor(max_depth=1)
predictr.fit(X,y,sample_weight=[5000,5000,1,1,1,1,1])
sklearn.tree.plot_tree(predictr);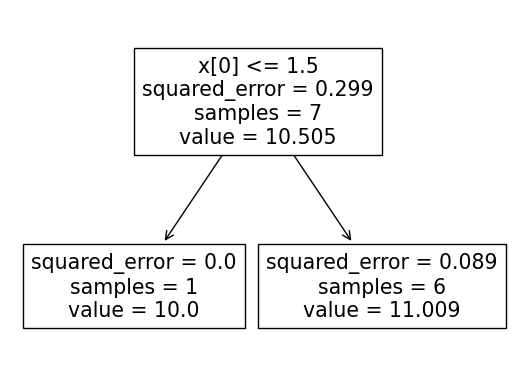
#