import numpy as np
import pandas as pd
import matplotlib.pyplot as plt
import matplotlib.animation
import IPython
import sklearn.tree
#---#
import warnings
warnings.filterwarnings('ignore')10wk-37: 아이스크림 – 의사결정나무, max_depth
1. 강의영상
2. Imports
3. Data
np.random.seed(43052)
temp = pd.read_csv('https://raw.githubusercontent.com/guebin/DV2022/master/posts/temp.csv').iloc[:,3].to_numpy()[:100]
temp.sort()
eps = np.random.randn(100)*3 # 오차
icecream_sales = 20 + temp * 2.5 + eps
df_train = pd.DataFrame({'temp':temp,'sales':icecream_sales})
df_train| temp | sales | |
|---|---|---|
| 0 | -4.1 | 10.900261 |
| 1 | -3.7 | 14.002524 |
| 2 | -3.0 | 15.928335 |
| 3 | -1.3 | 17.673681 |
| 4 | -0.5 | 19.463362 |
| ... | ... | ... |
| 95 | 12.4 | 54.926065 |
| 96 | 13.4 | 54.716129 |
| 97 | 14.7 | 56.194791 |
| 98 | 15.0 | 60.666163 |
| 99 | 15.2 | 61.561043 |
100 rows × 2 columns
plt.plot(df_train.temp,df_train.sales,'o')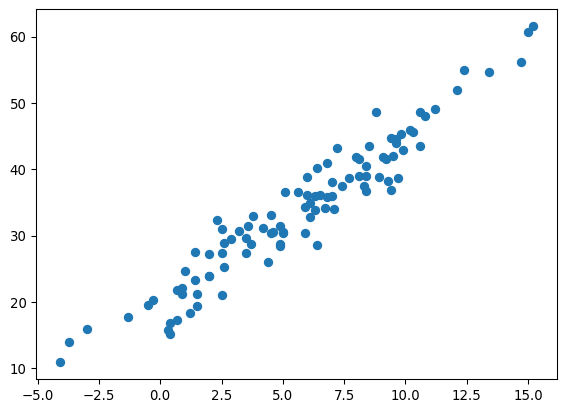
4. DecisionTreeRegressor (max_depth)
A. max_depth=1
- step1~4
## step1
X = df_train[['temp']]
y = df_train['sales']
## step2
predictr = sklearn.tree.DecisionTreeRegressor(max_depth=1)
## step3
predictr.fit(X,y)
## step4 -- pass
# predictr.predict(X) DecisionTreeRegressor(max_depth=1)In a Jupyter environment, please rerun this cell to show the HTML representation or trust the notebook.
On GitHub, the HTML representation is unable to render, please try loading this page with nbviewer.org.
DecisionTreeRegressor(max_depth=1)
- 결과 시각화
plt.plot(X,y,'o',alpha=0.5,label='True')
plt.plot(X,predictr.predict(X),'--.',label='Predicted')
plt.legend()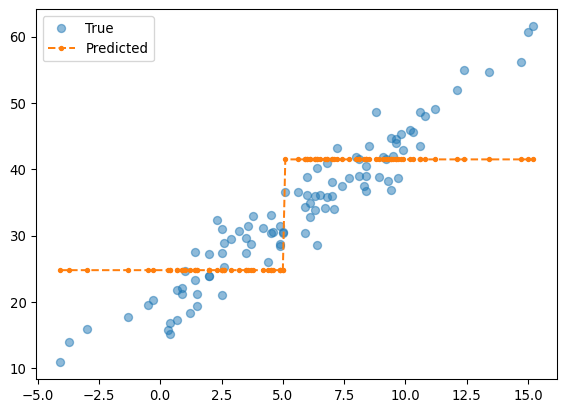
- tree 시각화
sklearn.tree.plot_tree(predictr)[Text(0.5, 0.75, 'x[0] <= 5.05\nsquared_error = 111.946\nsamples = 100\nvalue = 33.973'),
Text(0.25, 0.25, 'squared_error = 34.94\nsamples = 45\nvalue = 24.788'),
Text(0.75, 0.25, 'squared_error = 49.428\nsamples = 55\nvalue = 41.489')]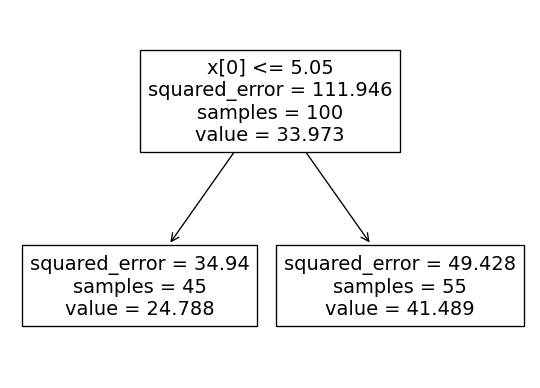
B. max_depth=2
- step1~4
## step1
X = df_train[['temp']]
y = df_train['sales']
## step2
predictr = sklearn.tree.DecisionTreeRegressor(max_depth=2)
## step3
predictr.fit(X,y)
## step4 -- pass
# predictr.predict(X) DecisionTreeRegressor(max_depth=2)In a Jupyter environment, please rerun this cell to show the HTML representation or trust the notebook.
On GitHub, the HTML representation is unable to render, please try loading this page with nbviewer.org.
DecisionTreeRegressor(max_depth=2)
- 결과 시각화
plt.plot(X,y,'o',alpha=0.5,label='True')
plt.plot(X,predictr.predict(X),'.--',label='Predicted')
plt.legend()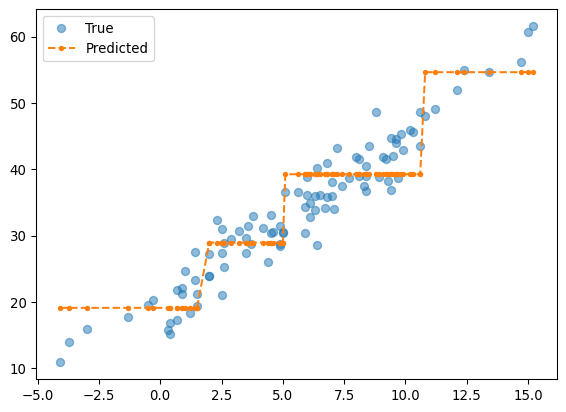
- tree 시각화
sklearn.tree.plot_tree(predictr)[Text(0.5, 0.8333333333333334, 'x[0] <= 5.05\nsquared_error = 111.946\nsamples = 100\nvalue = 33.973'),
Text(0.25, 0.5, 'x[0] <= 1.75\nsquared_error = 34.94\nsamples = 45\nvalue = 24.788'),
Text(0.125, 0.16666666666666666, 'squared_error = 15.12\nsamples = 19\nvalue = 19.105'),
Text(0.375, 0.16666666666666666, 'squared_error = 8.587\nsamples = 26\nvalue = 28.94'),
Text(0.75, 0.5, 'x[0] <= 10.7\nsquared_error = 49.428\nsamples = 55\nvalue = 41.489'),
Text(0.625, 0.16666666666666666, 'squared_error = 19.819\nsamples = 47\nvalue = 39.251'),
Text(0.875, 0.16666666666666666, 'squared_error = 21.051\nsamples = 8\nvalue = 54.638')]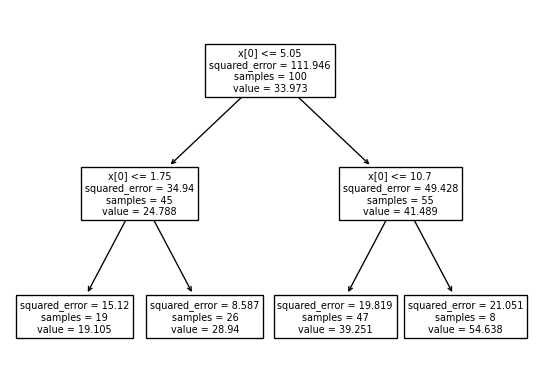
C. 애니메이션
- step1~4
## step1
X = df_train[['temp']]
y = df_train['sales']
## step2
predictrs = [sklearn.tree.DecisionTreeRegressor(max_depth=k) for k in range(1,11)]
## step3
for k in range(10):
    predictrs[k].fit(X,y)
## step4 -- pass
- 애니메이션
fig = plt.figure()<Figure size 672x480 with 0 Axes>def func(frame):
ax = fig.gca()
ax.clear()
ax.plot(X,y,'o',alpha=0.5)
ax.plot(X,predictrs[frame].predict(X),'.--')
ax.set_title(f'max_depth={predictrs[frame].max_depth}')ani = matplotlib.animation.FuncAnimation(
fig,
func,
frames=10
)display(IPython.display.HTML(ani.to_jshtml()))